Finding that all elusive "line of best fit" is the key to good linear regression. By changing the slope and y-intercept, you can get close to the perfect line for your data.
Today we will use a little
device we found called the Least
Squares Analyzer. It lets you set up a grid, plot 6 points, and then
play with the slope and
y-intercept until you find a combination that generates the "least
square" area.
So go ahead and read the intro
example and look at the pictures, then click on the link and try it out
for yourself. We supply you with two sets of data points and a few questions
to get you going.
Step 1: When you go
to the least
squares analyzer, this is what you will see at first.
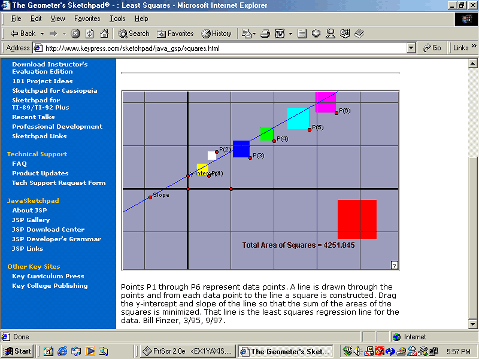
All of the red points are movable and three of them will change your
graph substantially.
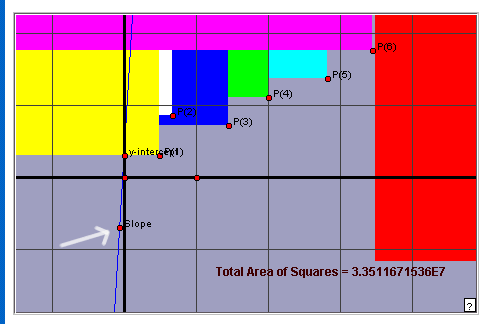
Step 2: The first thing you want to do is find your slope control dot and swing it around a bit. Put it near the bottom of the y axis and leave it there for now.
NOTE:
it's real important that you always be able to see that slope red dot.
If it goes off the page you won't be able to alter the slope.
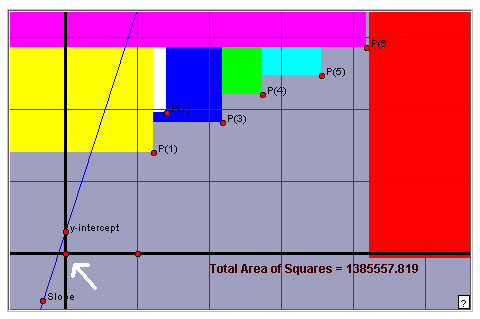
Step 3: Now play with the dot at the origin, (0,0). If you move that dot the entire grid goes with it. Be sure you don't lose your slope dot as you move the origin.
For our two examples, you will
need to set it so that the first quadrant fills most of the page.
Step 4: Now let's make
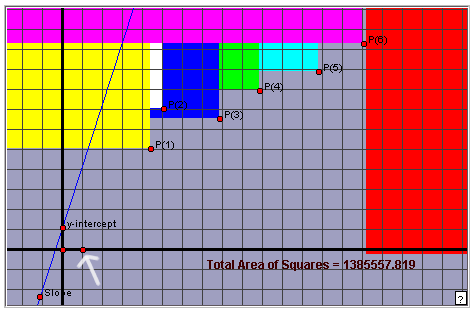
a grid with enough points to fit our data. If you move the red dot to
the right of the origin, you can create more squares. We will need 11
squares on the positive y axis.
Step 5: Now drag each
of the six points P(1) to P(6) onto your grid so that they represent your
six data points.
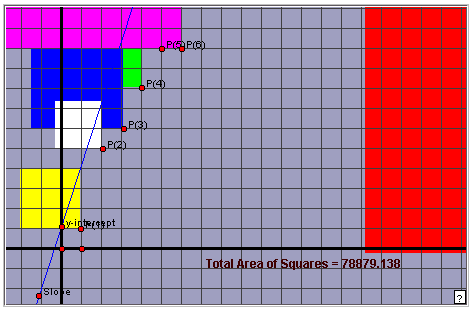
Step 6: Now experiment
by dragging your slope and y-intercept dots until you think you have found
the "least square" area possible. When you find it, you will
have a line of best fit.
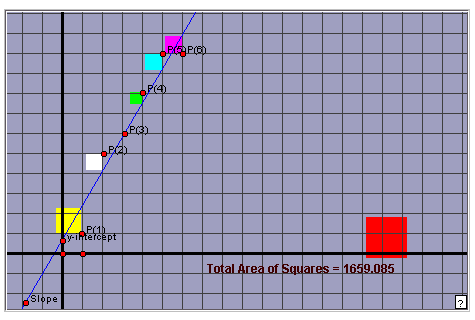
Step 6: Now select any two points on this line, find the slope between them, then substitute that slope and one of the points to find the equation for the line.
For a refresher on this process read the lesson, Linear Regression Day 1.
If you want to know the exact equation, you can always use a graphing calculator to do a regression or use the EQUATION GRAPHER.
EXAMPLE 1: go to the LEAST SQUARES ANALYZER
The other day Mrs. Bird was doing a survey on illegal gum chewing for the school newspaper. She visited 6 classrooms unannounced and did a quiet count of all the gum chewers in each room. She recorded the following data.
| No. of classrooms surveyed (x) | Total people in all rooms chewing gum (y) |
|
(1
|
1) |
|
(2
|
5) |
|
(3
|
6) |
|
(4
|
8) |
|
(5
|
10) |
|
(6
|
10) |
Now do the following steps:
- Align the grid so we have
11 blocks on the y axis.
- Position each of the points
P(1) through P(6) matching them with the data points on the chart.
- Adjust the slope and y-intercept
until you think you have the absolute "least square" area
possible. This will take a good bit of experimentation the first time
you play with it.
- Now determine the slope
from your graph and write it here.
- Now determine the y-intercept
and write it here.
- Now write the equation using
the slope and the y intercept and write it here.
- If there are 75 rooms in
our school, how many illegal gum chewers will there be?
EXAMPLE 2: go to
the LEAST
SQUARES ANALYZER
Mrs. Loughry is on this new miracle diet. All she has to do is eat this
ancient bread called Hanza Bread. It has some mysterious chemicals in
it that make her not hungry for up to 8 hours. She has been on it for
six days and her weight is coming down fast. Below is the record of her
weight loss.
| No. of days on diet (x) | Weight at end of day (y) |
|
(1
|
130) |
|
(2
|
127) |
|
(3
|
125) |
|
(4
|
121) |
|
(5
|
122) |
|
(6
|
120) |
Now do the following steps:
- Align the grid so we have
12 blocks on the y axis. Let the "x" axis stand for 120 lb.
and each block represent a pound. This will take you up to 132 pounds
on the top line.
- Position each of the points
P(1) through P(6) matching them with the data points on the chart.
- Adjust the slope and y-intercept
until you think you have the absolute "least square" area
possible.
- Now determine the slope
from your graph and write it here.
- Now determine the y-intercept
and write it here.
- Now write the equation using
the slope and the y intercept and write it here.
- How many days will Mrs. Loughry have to stay on this diet to reach a weight of 100 pounds?
For more regressions check out these:
day1 activity | day 3 activity | day 4 activity | Barbie Bungee Activity
Home | About
Us | Algebra| Dictionary | Games | Geometry | Gym | Humor | Lab | Magic | Natural Math | PreAlgebra | Resources | Teachers Only | Toolbox | Treasures | Videos | Wonders | Writings |
Copyright © 1999-2020 themathlab.com
