Find the Numbers to CONTROL the GRAPH
Follow the steps below
to see how changing the numbers of a linear equation can alter the look
of its graph. Check off each step as you go.
NAME:
To begin, you will need to find a graphing calculator or a software program that will graph equations for you. If you need a program like that, you can download a 30 day trial version of EQUATION GRAPHER here. (We use this program at themathlab.com.)
Each calculator and piece of software is a bit different, so experiment, read your manual, and get to know your "automatic grapher" as you complete the following steps.
-10 to +10 on BOTH the x and y axes. Also set your step or increment value to one for both axes.
Have your machine graph the
linear equation y = x.
Describe in detail what it looks like below:
i.e. How steep is it?
Is it going "uphill" or downhill" as you look at it from
left to right?
Where does the line cross the y axis?
Now draw y = -x. Describe how adding the negative sign changes the original line.
Draw y = 2x, and then y = 5x. Describe how the numbers 2 and 5 change your original y = x graph.
Try y = 100x. What happens? Why do you think we can't see it very well?
Change the range values to Ymin = -5 and Ymax = 100. Describe what happens.
Now change the domain values to Xmin = -1 and Xmax = 2. Describe what happens.
Now graph y = (1/2)x.
Be sure to use the parentheses or you will get a strange graph. You could
also use y = 0.5x. Describe how this changes from the graph of
y = x.
Now graph y = 1/2x without the parentheses. Describe what the graph looks like.
Graph y = (-1/5)x. Describe what happens to the line.
Now graph y = (-1/100)x. Describe the graph.
Change the range values so you can see this better. When you get it the way you like, tell us what values you used.
Graph y = x + 3 and describe how this differs from the graph of y = x.
What similarities do you notice about these two lines; y = x and y = x + 3.
Graph y = x - 3 and describe how it differs from y = x.
What similarities do you notice about these three lines?
Graph y = -x + 3 and describe this line. Be sure to mention how steep it is, if it is sloping downhill or uphill and where it crosses the y axis.
Graph y = -x - 3 and describe this line.
What do the lines from steps 20 and 21 have in common?
Graph y = -x + 20. Can you see it? What can you do to see it?
Graph the following lines,
and examine them closely as you do.
Try to figure out which numbers are moving the lines in which ways.
- y = 3x + 4
- y = -3x + 4
- y = 3x - 4
- y = -3x -4
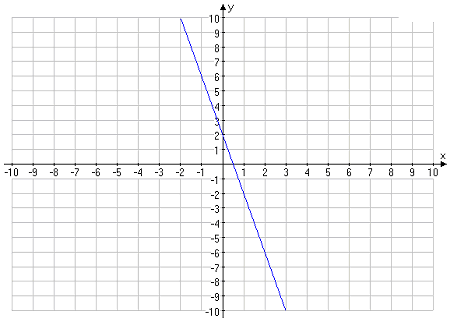
Based upon your experimentation above, try to find an equation that will give you the graph below. When you find it write it in the space provided.
|
Equation |
Based upon your experimentation above, try to find an equation that will give you the graph below. When you find it write it in the space provided.

Equation
Home | About
Us | Algebra| Dictionary | Games | Geometry | Gym | Humor | Lab | Magic | Natural Math | PreAlgebra | Resources | Teachers Only | Toolbox | Treasures | Videos | Wonders | Writings |
Copyright © 1999-2020 themathlab.com

